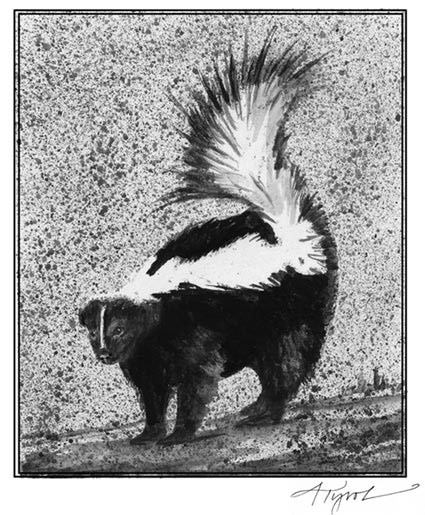
A joint Harvard-Smithsonian study released today in the journal PLOS ONE reveals how much — and how little — Northeastern forests have changed after centuries of intensive land use.
A hike through today’s woods will reveal the same types of trees that a colonial settler would have encountered 400 years ago. But the similarities end there. Jonathan Thompson, research associate at the Smithsonian Conservation Biology Institute and lead author of the new study, explains, “If you only looked at a tree species list, you’d have the impression that Northeast forests haven’t changed. But once you start mapping the trees, and counting them up, a different picture emerges.” Thompson adds, “In some ways the forest is completely transformed.”
slabcityhistorical
ABOVE: A view of the Swift River Valley in Central Massachusetts, photographed in 1890. The image shows extensive forest clearing for agriculture. (Photo courtesy of the Harvard Forest Archive) BELOW: The same view photographed today. Forests have made a similar recovery in many parts of the Northeastern U.S. (Photo by David Foster)
To draw these conclusions, Thompson and his colleagues compared colonial-era tree records to modern US Forest Service data across a 9-state area stretching from Pennsylvania to Maine.
Their results show stark contrasts between pre-colonial forests and today. Maples have exploded across the Northeast, their numbers increasing by more than 20 percent in most towns. Other tree types have declined sharply. Beeches, oaks, and chestnuts show the most pronounced loss — big trouble, Thompson notes, for wildlife that depend on tree nuts for winter survival.slabcityforested
Pine numbers have shifted more than any other tree type, increasing in some places, decreasing elsewhere. Thompson pins this variability to ecology and economy: “Pine is valuable for timber, but quick to return after cutting. It has a social and environmental dynamism to it.”
The nine states in the study share a similar — and notable — forest history: during the 18th and 19th centuries, more than half the forestland was cleared for agriculture and cut for timber. Most farms were eventually abandoned, and during the 20th century, forests returned. Today about 80 percent of the Northeast is forested.
Fig3_Forest_compositional_comparison
This graphic shows the relative abundance of pre-colonial Witness Trees and modern trees in 701 Northeast towns.
Driving the study is a historical data source that has never been analyzed at such a massive scale: the maps and notes of the earliest colonial surveyors. These scribbles and dots on old records document individual “witness trees” — trees mapped between 1650 and 1850 to designate property boundaries when towns were first established.

The historical dioramas in the Harvard Forest Fisher Museum tell the story of the region’s forest loss(far right and middle) and regrowth(far left) (Photo courtesy of the Harvard Forest)

Charlie Cogbill, an ecologist on the research team, spent three decades compiling these early records from the public archives of nearly 1,300 towns. The massive geo-database he built pinpoints the location of more than 350,000 witness trees, forming the basis of this study.

American chestnut is one of several trees to show strong declines since pre-colonial times. An invasive fungal blight nearly extirpated chestnuts in the early 20th century, and the blight continues today. (Photo by David Foster.)


Even 200 years later, the legacy of colonial farming remains the most powerful factor in determining modern forest composition — more powerful than regional climate, soil conditions, and many other factors. “To get a sense of how much a forest has changed, the first question to ask is how extensively the area was farmed over the past two centuries,” says Dunbar Carpenter, co-author of the study and research assistant at the University of Wisconsin-Madison. If more than half the town was farmed, he adds, local forests have probably diverged a good deal from their pre-colonial condition.David Foster, co-author of the study and director of the Harvard Forest in Massachusetts, explains, “It is critical to understand the nature and scale of forest change triggered by human impacts. Charlie’s effort to amass the witness trees provides a serendipitous window into the region’s earliest forests, enabling us to assess the cumulative effect of centuries of land use and climate change.”

Northeastern birds and animals that depend on acorns
and beechnuts for food in Fall include Wild Turkeys,

 Deer, gray squirrels, red squirrels, chipmunks, wild turkeys, crows, flying squirrels, rabbits, opossums, blue jays, quail,  raccoons, wood ducks—more than 100 U.S. vertebrate species eat acorns. In autumn and winter, the acorn is the cheeseburger of the forest ecosystem—fairly easy to find and nicely packaged. They are one of the most valuable food resources available for wildlife--the fruit of Oak trees, acorns are!


Many birds and mammals feed on beech nuts, including ruffed grouse, turkeys, wood ducks, blue jays, white-breasted nuthatches, and various woodpeckers, as well as black bear, squirrels, chipmunks, mice, and deer.


Wild Turkey


Eastern Fisher


Gray Squirrel


Chipmunk

Black Bear


Blue Jay


Whitetail Deer


Across the board, reports the study, these changes have made modern forests more homogenous and less responsive to small changes in temperature and precipitation. Despite forest clearing, widespread logging, fires, climate change, invasive pests, and disease, the Northeast remains the most heavily forested region of the country.
“The overriding theme of this forest region is resilience in the face of multiple impacts,” notes Foster. “This is an important lesson for the future. If we do not replace forests with houses and pavement, they will endure future challenges as well.”
Thompson echoes this theme of resilience. “The Northeast wants to be a forest,” he says. “If you stop mowing your lawn, you’ll get a forest. That’s essentially what we did in the mid-1800s — we stopped mowing fifty percent of the landscape. What happens ecologically in the wake of that? The Northeast is the first place where we’ve watched it happen.”
And the story is still unfolding.  — Source: Harvard Forest, Harvard University
-----------------------------------------------------------------------
% of Forestland by state(as of 2016)
RankState, district
or territory
Percent
forest
(2016)
]
1 Maine89.46%
2 New Hampshire84.32%
3 American Samoa80.84%
4 Northern Mariana Islands80.37%
5 West Virginia79.01%
6 Vermont77.82%
7 Alabama70.57%
8 South Carolina68.19%
9 Georgia67.28%
10 Mississippi65.07%
11 Virginia62.93%
12 New York62.88%
13 Massachusetts60.57%
14 North Carolina59.73%
15 Pennsylvania58.60%
16United States Virgin Islands Virgin Islands (U.S.)57.16%
17 Arkansas56.31%
18 Puerto Rico55.62%
19 Michigan55.62%
20 Connecticut55.24%
21 Rhode Island54.38%
22 Louisiana53.20%
23 Tennessee52.83%
24 Guam52.82%
25 Washington52.74%
26 Florida50.68%
27 Kentucky49.35%
28 Wisconsin48.98%
29 Oregon48.51%
30 Hawaii42.53%
31 New Jersey41.72%
32 Idaho40.55%
33 Maryland39.36%
34 Texas37.33%
35 Missouri35.16%
36 Alaska35.16%
37 Utah34.48%
38 Colorado34.42%
39 Minnesota34.08%
40 District of Columbia33.90%[7]
41 California32.71%
42 New Mexico31.99%
43 Ohio30.92%
44 Oklahoma28.80%
45 Montana27.45%
46 Delaware27.26%
47 Arizona25.64%
48 Indiana21.06%
49 Wyoming18.42%
50 Nevada15.89%
51 Illinois13.64%
52 Iowa8.43%
53 Kansas4.78%
54 South Dakota3.93%
55 Nebraska3.20%
56  North Dakota1.72%
--------------------------------------------------------

Total Forest Land (most recent) by state


DEFINITION: Total area of forest land in millions of acres. NOTE: Because of the difficulty in gathering these statistics across independent state agencies, some states may be missing. Arizona, Arkansas, Hawaii, Illinois, Ohio and Maine did not report.
VIEW DATA: Totals
Definition     Source      Printable version   
  Bar GraphPie ChartMap

Showing latest available data.

Rank  States  Amount  
# 1    Alaska:127.38 million acres 
# 2    Oregon:28.836 million acres 
# 3    Georgia:24.4 million acres 
# 4    California:23.7 million acres 
# 5    Idaho:23.5 million acres 
# 6    Alabama:22.991 million acres 
# 7    Montana:22.5 million acres 
# 8    Colorado:21.637 million acres 
# 9    Washington:21.3 million acres 
# 10    Michigan:19.3 million acres 
# 11    Mississippi:18.605 million acres 
# 12    New York:18.4 million acres 
# 13    North Carolina:18.269 million acres 
# 14    New Mexico:16.68 million acres 
# 15    Pennsylvania:16.585 million acres 
# 16    Minnesota:16.23 million acres 
# 17    Wisconsin:15.965 million acres 
# 18    Virginia:15.844 million acres 
# 19    Utah:15.173 million acres 
# 20    Missouri:15.01 million acres 
# 21    Florida:14.7 million acres 
# 22    Tennessee:14.404 million acres 
# 23    Louisiana:14.017 million acres 
# 24    South Carolina:12.415 million acres 
# 25    West Virginia:12.001 million acres 
# 26    Kentucky:11.931 million acres 
# 27    Texas:11.879 million acres 
# 28    Wyoming:10.995 million acres 
# 29    Nevada:9.767 million acres 
# 30    Oklahoma:7.665 million acres 
# 31    New Hampshire:4.824 million acres 
# 32    Vermont:4.628 million acres 
# 33    Indiana:4.554 million acres 
# 34    Massachusetts:3.13 million acres 
# 35    Iowa:2.7 million acres 
# 36    Maryland:2.566 million acres 
# 37    Kansas:2.226 million acres 
# 38    New Jersey:1.876 million acres 
# 39    Connecticut:1.859 million acres 
# 40    South Dakota:1.62 million acres 
# 41    Nebraska:1.275 million acres 
# 42    North Dakota:0.673 million acres 
# 43    Rhode Island:0.393 million acres 
# 44    Delaware:0.383 million acres 
Total:654.786 million acres  
Weighted average:14.9 million acres